
Working Papers
Designing High-Frequency Market Liquidity Measures with Applications to Monetary Policy, with Oliver Linton, Yunxiao Zhai, and Haotian Zhang. • Supplement
Abstract: We propose a new family of liquidity measures—including order imbalance metrics—based on the dispersion and persistence of transitory gaps between transaction prices and the underlying efficient price. We devise an estimation method that renders these latent gaps observable, allowing plug-in estimates of the new measures from intraday trades alone, along with an inference method that allows us to quantify the sampling uncertainty in our estimates. We apply the approach to the S&P 500 equity portfolio, as well as to individual stocks. We use event study methodology to capture heterogeneous liquidity responses to FOMC announcements, which reveals distinct order-persistence patterns on surprise versus non-surprise days, highlighting how markets anticipate and react to monetary policy via the liquidity channel.
Empirical Highlights:
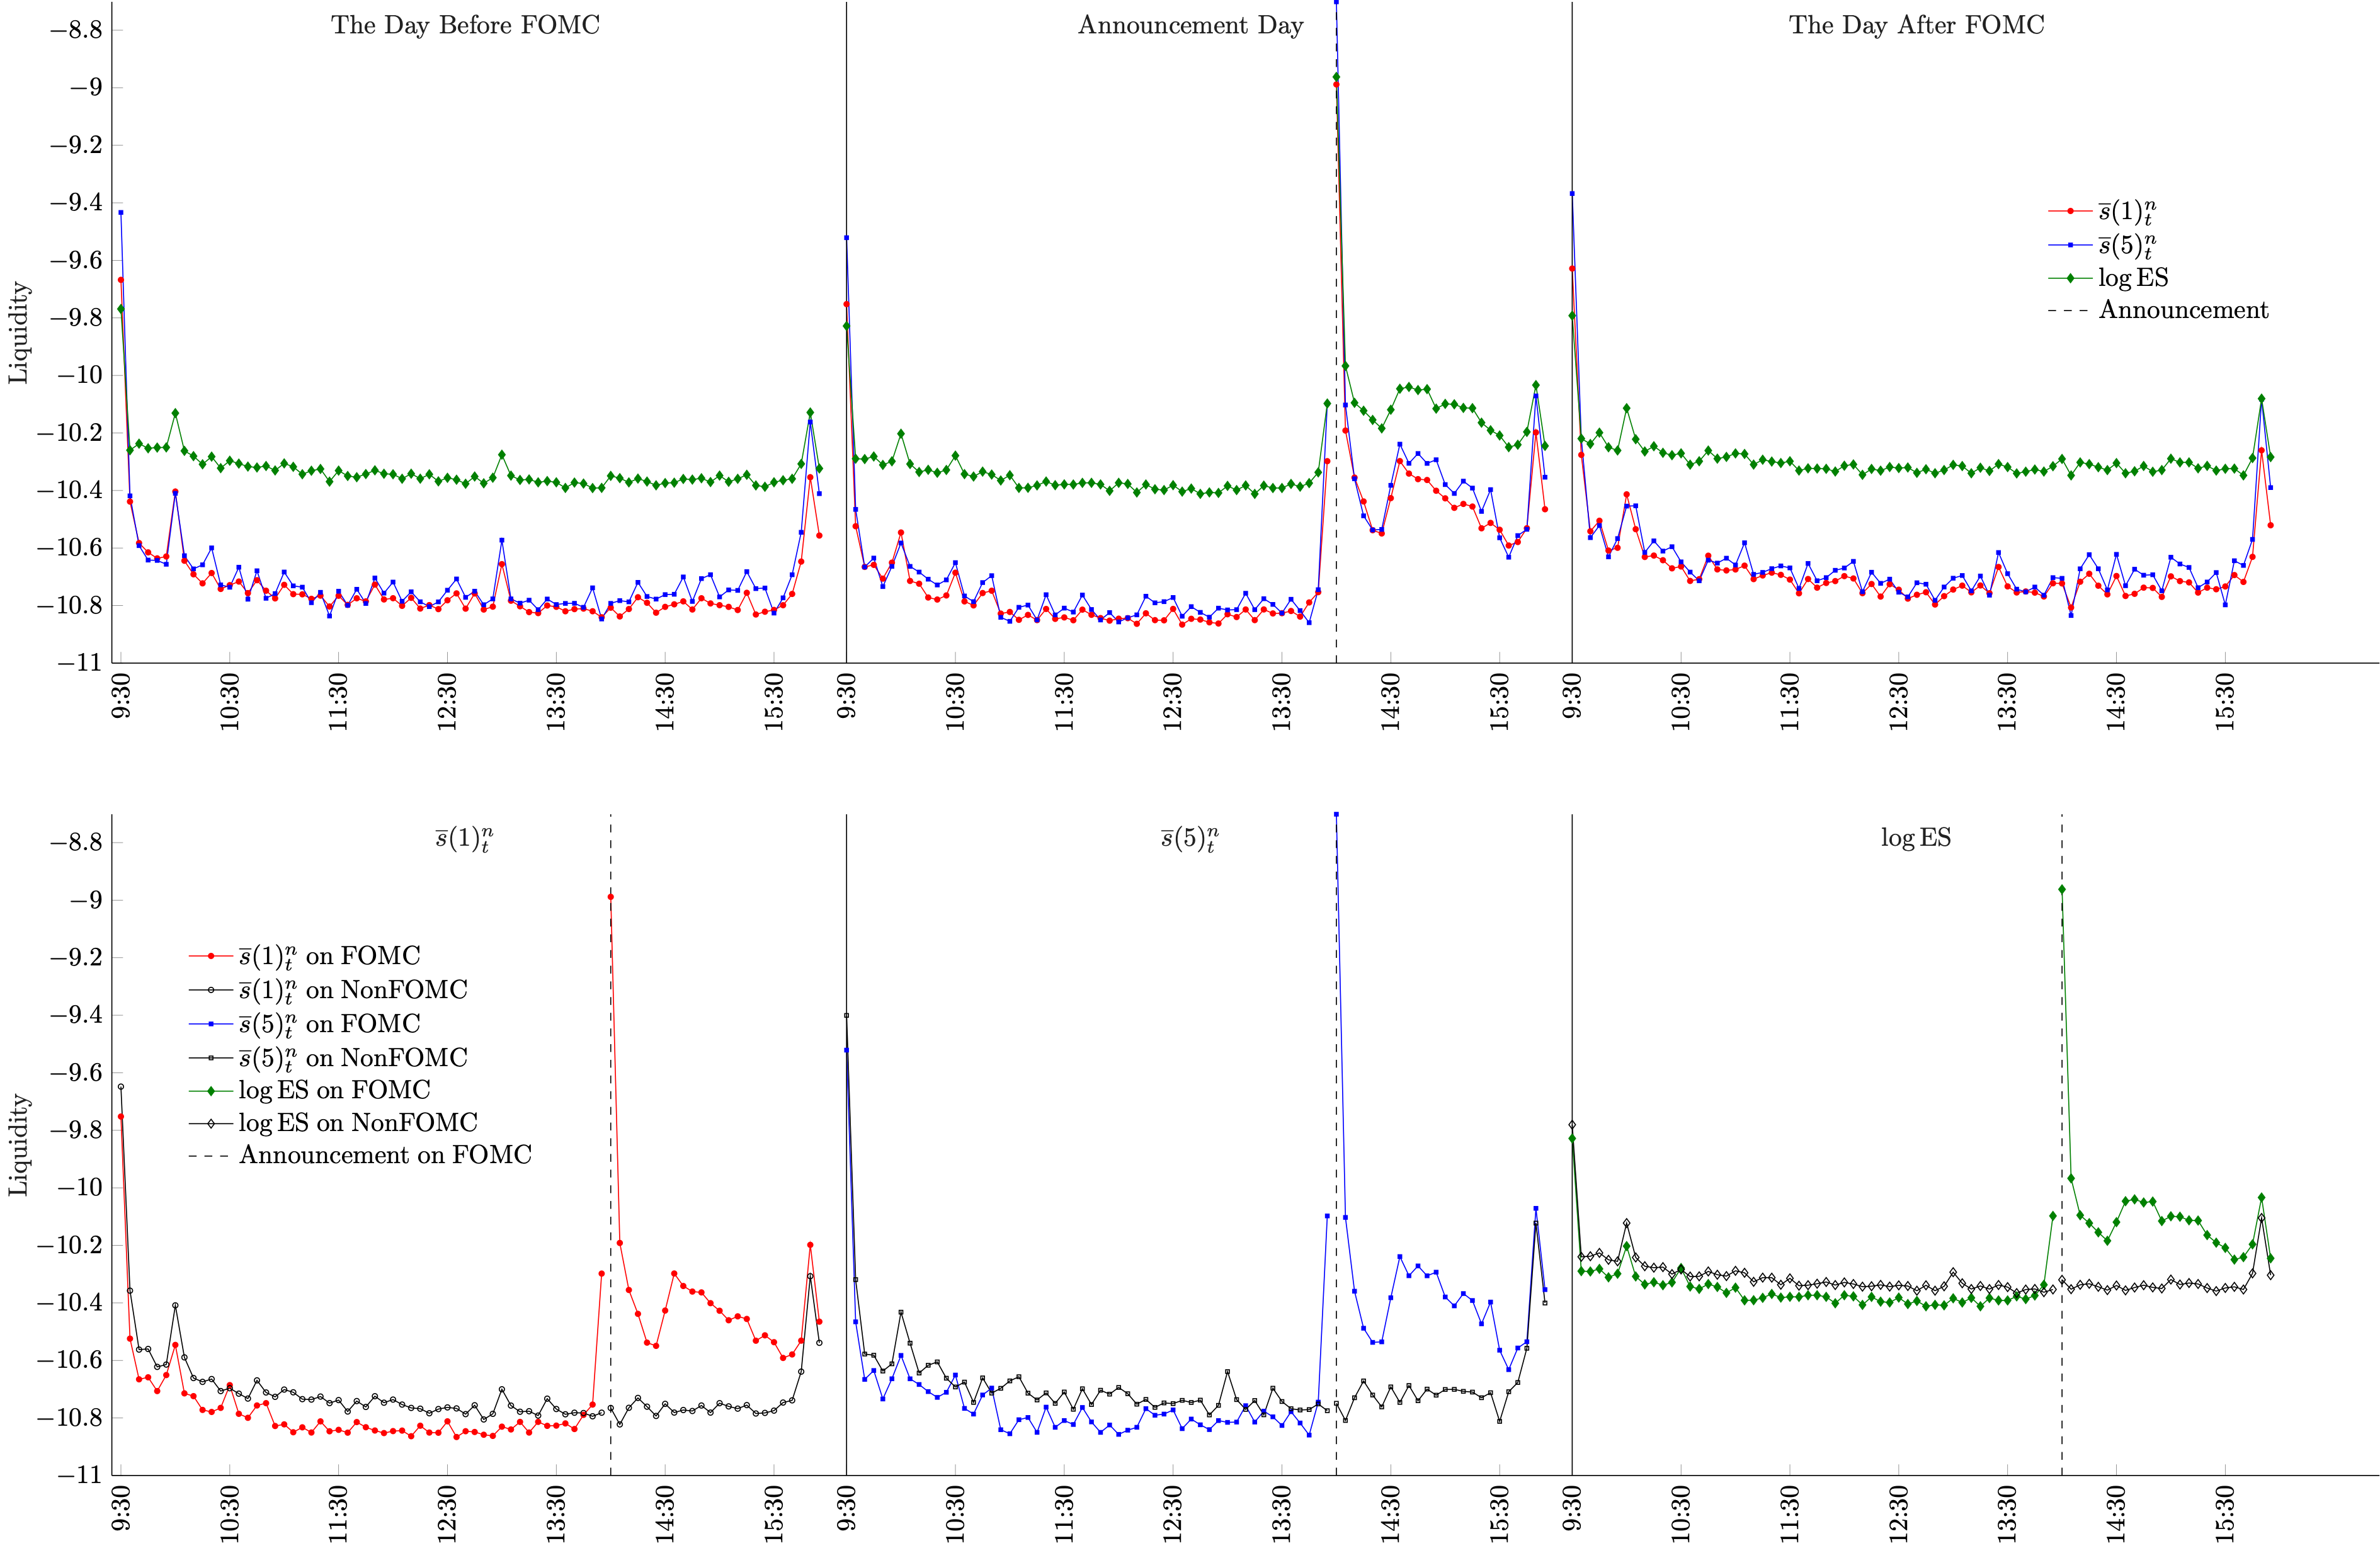 Figure: Liquidity Dynamics Around FOMC Announcements at 14:00. The top panel displays averaged log-estimates of proposed liquidity measures (${\mathcal{S}}(m)^n_t$ for $m=1,5$) alongside the log effective spread (ES), grouped by trading days prior to, during, and after FOMC announcements. The bottom panel contrasts these measures on FOMC days with estimates from non-FOMC days (control groups), represented by black dotted lines.
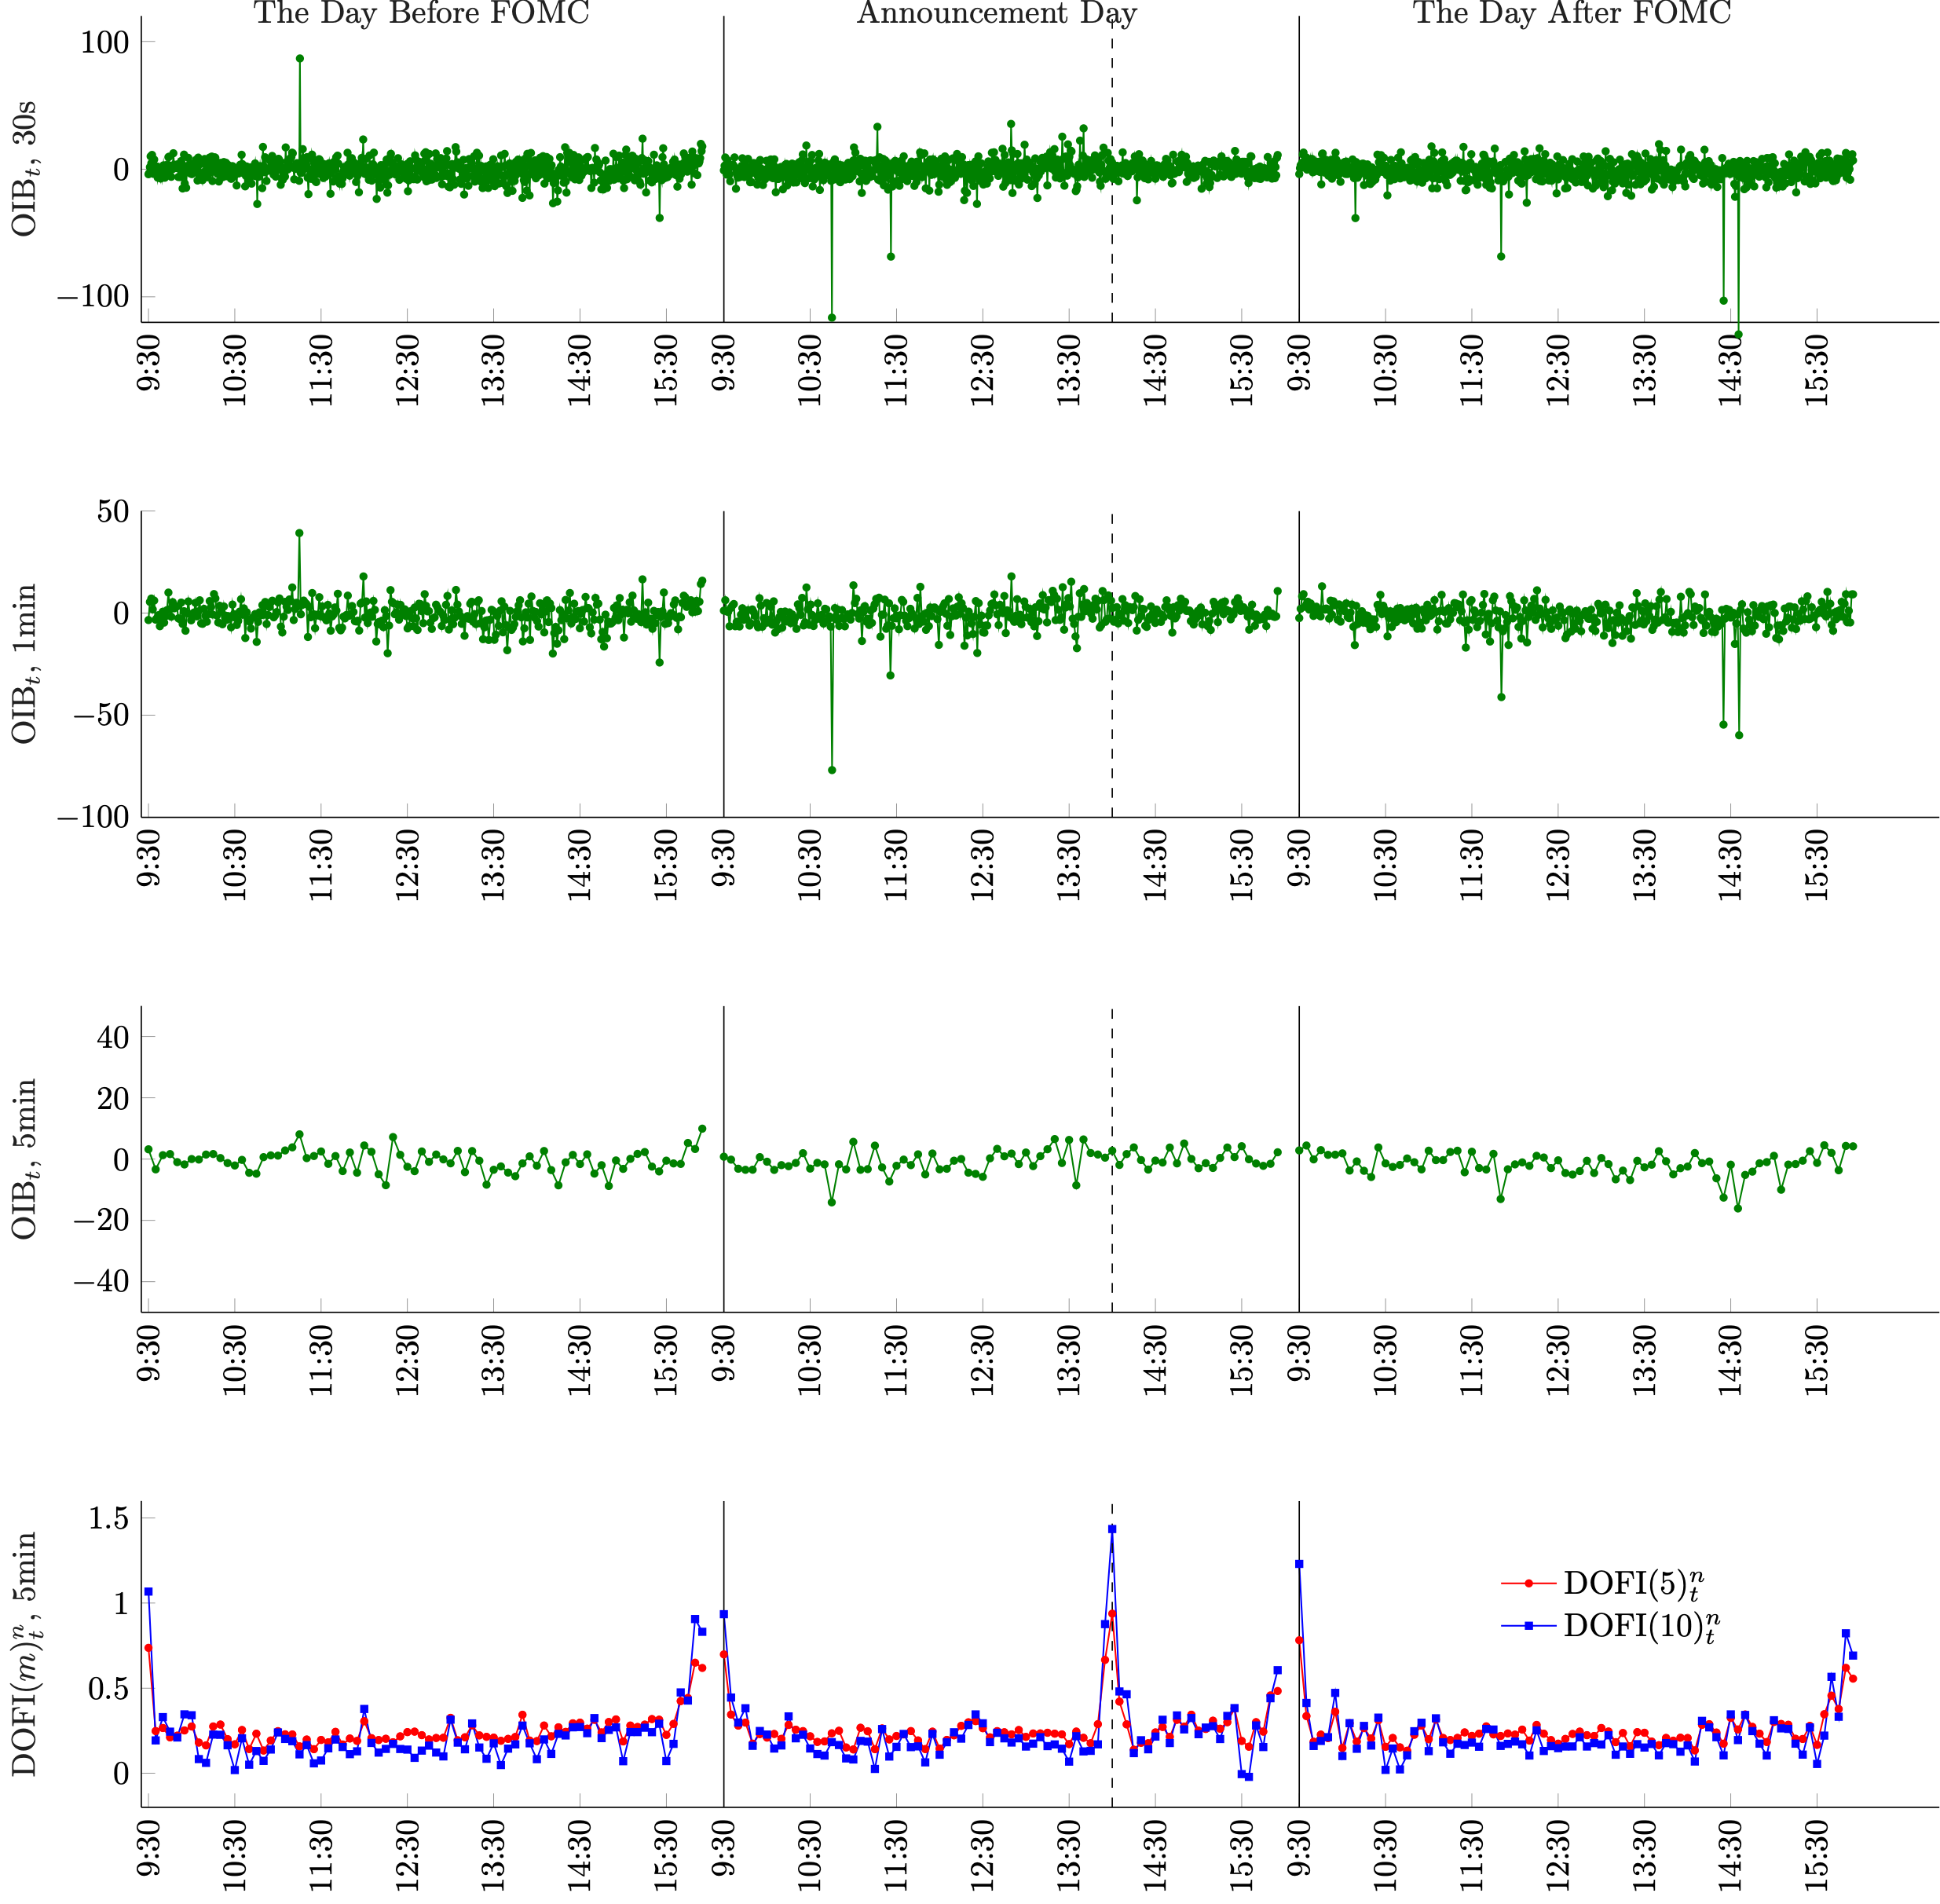 Figure: Order-imbalance measures around FOMC announcements (14:00). The figure plots intraday averages of order-imbalance metrics for three event windows: the trading day before the FOMC meeting (left column), the announcement day (middle column), and the trading day after the meeting (right column). The dashed vertical line in the middle column marks the scheduled announcement time at 14:00. The top three rows report the conventional order-imbalance measures computed at different aggregation frequencies: 30-second intervals (top row), 1-minute intervals (second row), and 5-minute intervals (third row). The bottom panel plots our proposed new order imbalance measures DOFI(m) with $m=5, 10$.